Bridging the Gap: Innovations in Communication using StoryMaps
Byline: FACO Training & Network Specialist Lara Thomas
I found myself amid the bustling Sustaining Colorado Watersheds Conference poster session amongst a myriad of engaging presentations on watershed conservation issues, each vying for attention when I encountered Lauren Magliozzi (PhD Candidate at the University of Colorado Boulder, Environmental Engineering Program), whose nontraditional approach immediately captured my interest.
Instead of the typical poster board and table, Lauren’s presentation was simply a large touchscreen monitor alongside a project title and QR code. She seamlessly navigated her story map, enthusiastically weaving a compelling narrative with each swipe and tap. What made her presentation unique was the harmonious blend of maps and data, intricately interwoven with relevant photos and videos that breathed life into her data-driven story.
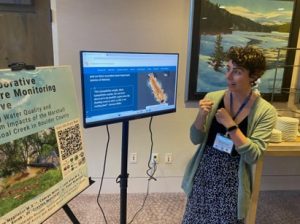
As I listened, I couldn’t help but notice the smiles and engagement of fellow conference professionals who gathered around her monitor. They, too, were captivated by the interactive journey unfolding before them. Beyond the interactive content, what truly sparked excitement was the innovative StoryMap tool itself. Inspired by Lauren’s presentation, others in attendance eagerly shared their story map successes, praising its user-friendly interface and eye-catching features. At that moment, I realized I had witnessed both an important post-fire monitoring presentation and a testament to the power of GIS-based storytelling.
Regarding her presentation, Lauren Magliozzi shares, “Choosing a virtual story map over a conventional conference poster was a calculated risk but given the pioneering nature of the Sustaining Colorado Watersheds Conference, it felt like the right platform for something new. Last year, my traditional paper poster received good engagement during the conference, but now, I can’t help but think of it languishing in a forgotten cardboard tube somewhere in the lab. This year, I wanted to create something with a longer shelf life – a resource that could be utilized far beyond the conference.
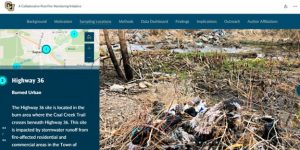
Engaging with community members while we are out monitoring Coal Creek after the Marshall Fire has been a transformative experience. As a member of the academic community, stepping into the realm of public engagement demands a certain courage. We’re accustomed to operating as impartial third parties, and answering questions like, ‘Is our creek safe after the fire?’ Having a robust, engaging tool at our disposal to provide immediate information has been a game-changer. Now, when someone expresses interest in our work, we can respond enthusiastically and simply share a QR code that grants instant access to our StoryMap on their mobile device. It also directs them to other valuable resources like Coal Creek Trail information, EPA’s National Recommended Water Quality Criteria for Aquatic Life, and upcoming public engagement events like the Clean Up the Creek event.
I already use ArcGIS for some of my analyses, so it was great that I didn’t need to master a new program to create a public-facing tool. I liked the code snippets and embedding features. I wasn’t sure about incorporating our public data dashboard, supported by R Shiny, but StoryMaps’ general compatibility with external tools made this integration painless.”
Embracing innovative tools like StoryMaps revolutionizes how we communicate and engage our stakeholders and the public. Witnessing Lauren and her team’s approach has shown the potential these technologies hold in bridging the gap between the knowledge body of the scientific community and public engagement.
ArcGIS StoryMaps will help you tell remarkable stories with geographic information system (GIS)-based maps that inform and inspire. A digital story can effect change, influence opinion, and create awareness—and maps are an integral part of storytelling. ArcGIS StoryMaps is a built-in feature of the ArcGIS system that gives your narrative a stronger sense of place, illustrates spatial relationships, and adds visual appeal and credibility to your ideas. [SOURCE: esri]
Many of you are likely taking steps to developing your next CWPP, or other planning or recovery document. Take a step out of your comfort zone and Discover the possibilities with ArcGIS StoryMaps! I leave you with a few more ArcGIS Storymaps to explore and to inspire your storytelling shift From Paper to Pixels.
Storymaps to shift your planning paradigm from paper to pixels:
Loveland Fire Rescue Authority CWPP
Denver Hazard Mitigation Plan Story Map
Mitigating Wildfire: Evergreen Needs Everyone (CMAT)
Prescribed Fire In Northern Colorado (CFRI)
Calwood and Cameron Peak fires
Grassland Management in Boulder County